Turn numbers into growth
We connect all your data sources, centralize everything in a data warehouse, and build dashboards that your team actually uses. For 10 years the BI partner for eCommerce.
From raw data to action
Connect
We connect all your data sources: from webshop to accounting, from logistics to marketing. 500+ possible integrations.
Centralize & clean
All data comes together in a central data warehouse. We clean it, structure it, and make it reliable.
Insight & action
From PowerBI dashboards to daily email reports, smart alerts, TV screens and in-depth analyses.
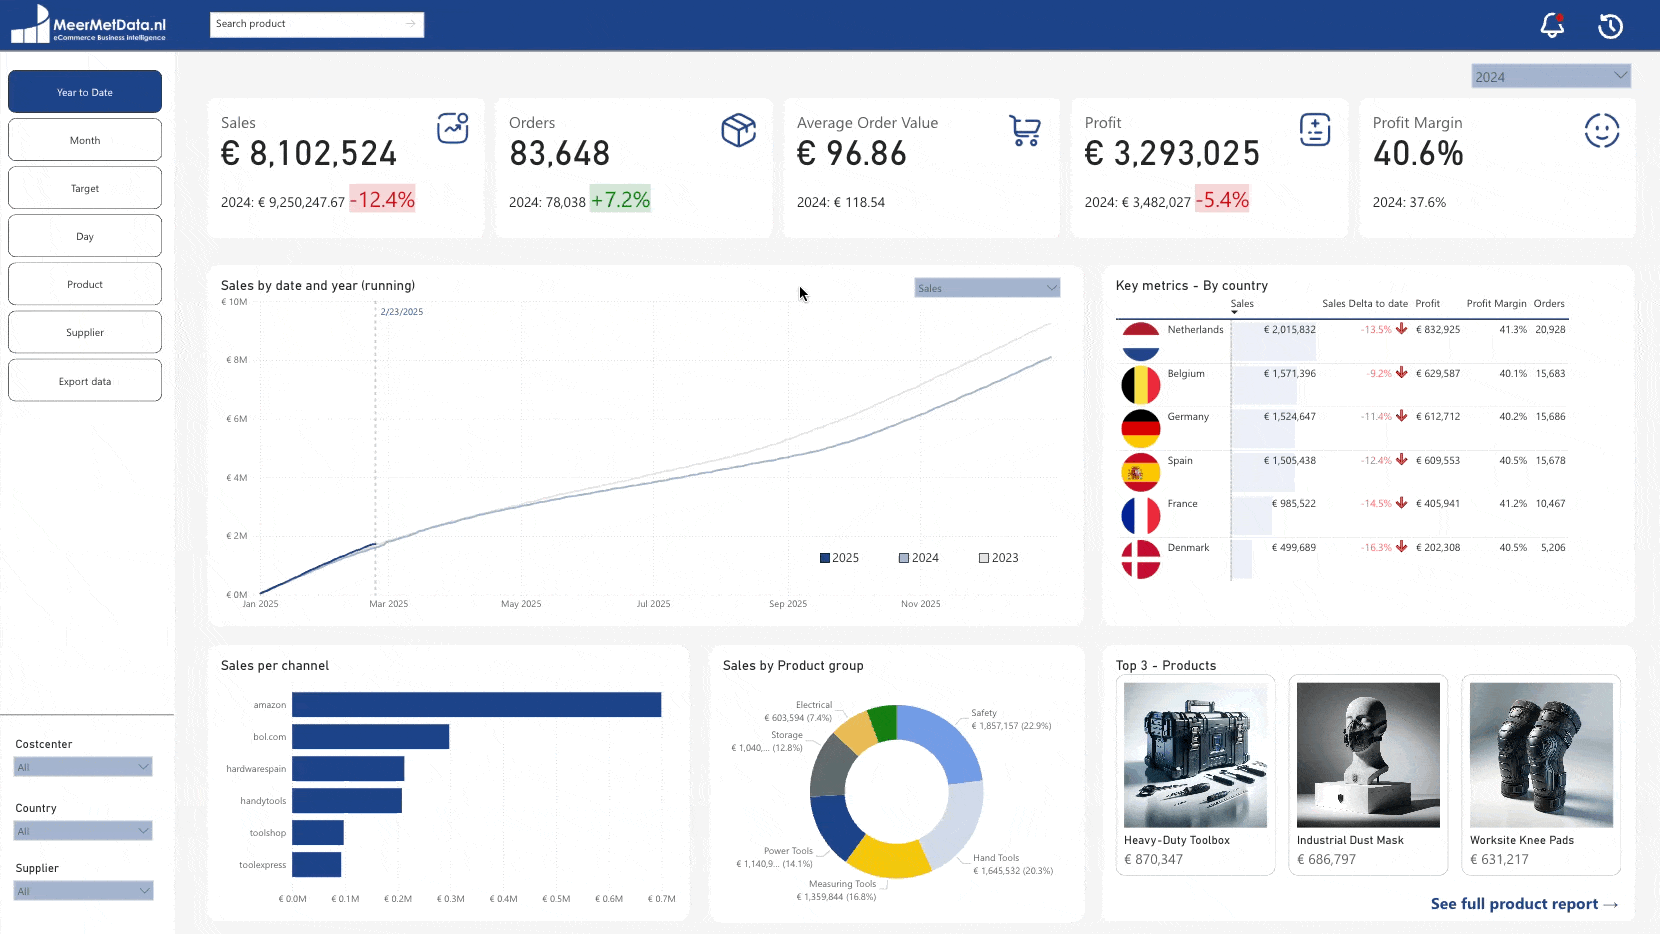
Custom dashboards, reports and analyses
Built on your data warehouse. Always up-to-date, always reliable.
Data Warehouse
A data warehouse is a central place where all your data sources come together, cleaned up and ready for analysis. It is the foundation of everything. We build a centralized data warehouse that unlocks 500+ data sources: from webshop to accounting, logistics to marketing.
MeerMetData MCP
The MeerMetData MCP is a secure connection that lets your AI assistant such as ChatGPT or Claude query and analyse your own data directly. Ask questions in plain language and get answers, charts and analyses straight from your data warehouse, without writing SQL yourself.
Product Performance
Product performance analysis is the insight into how each product, category and brand performs in terms of sales, margins, returns and trends. Which products are growing, which are declining? Insight into sales, margins, returns and trends per product, category and brand.
Finance & Cashflow
Finance and cashflow reporting is a dashboard that brings your financial figures together, from P&L and cashflow to budgeting and forecasting. Always current financial insights at every level of your organization.
Profit Matrix
A Profit Matrix is a dashboard that shows per product and channel where you actually make money after all costs. Insight into profitability per customer, channel, product and market. Understand where you really make money.
Customer Behaviour
Customer behaviour analysis is the study of how customers buy, return and stay loyal, through cohort analysis, retention, CLV and purchase patterns. Understand your customer and discover who your best customers are.
Logistics & Operations
A logistics and operations dashboard makes delivery times, fulfilment performance and operational KPIs visible in real-time. Everything you need to keep your operation running smoothly.
Attributie & Contribution Margin
Attribution and contribution margin analysis links each marketing channel to the profit it actually generates, from first-touch to last-click attribution combined with real margins and costs. Which channels really deliver profit?
PowerBI Dashboards
A Power BI dashboard is an interactive report that gives real-time insight into your most important KPIs in one overview. Custom-built for your organization.
Standing on the shoulders of giants
Our approach was shaped at Coolblue and refined through 10 years of collaboration with the best eCommerce companies in the Netherlands. From Toppy.nl to XXL Nutrition. The lessons are built into everything we do.
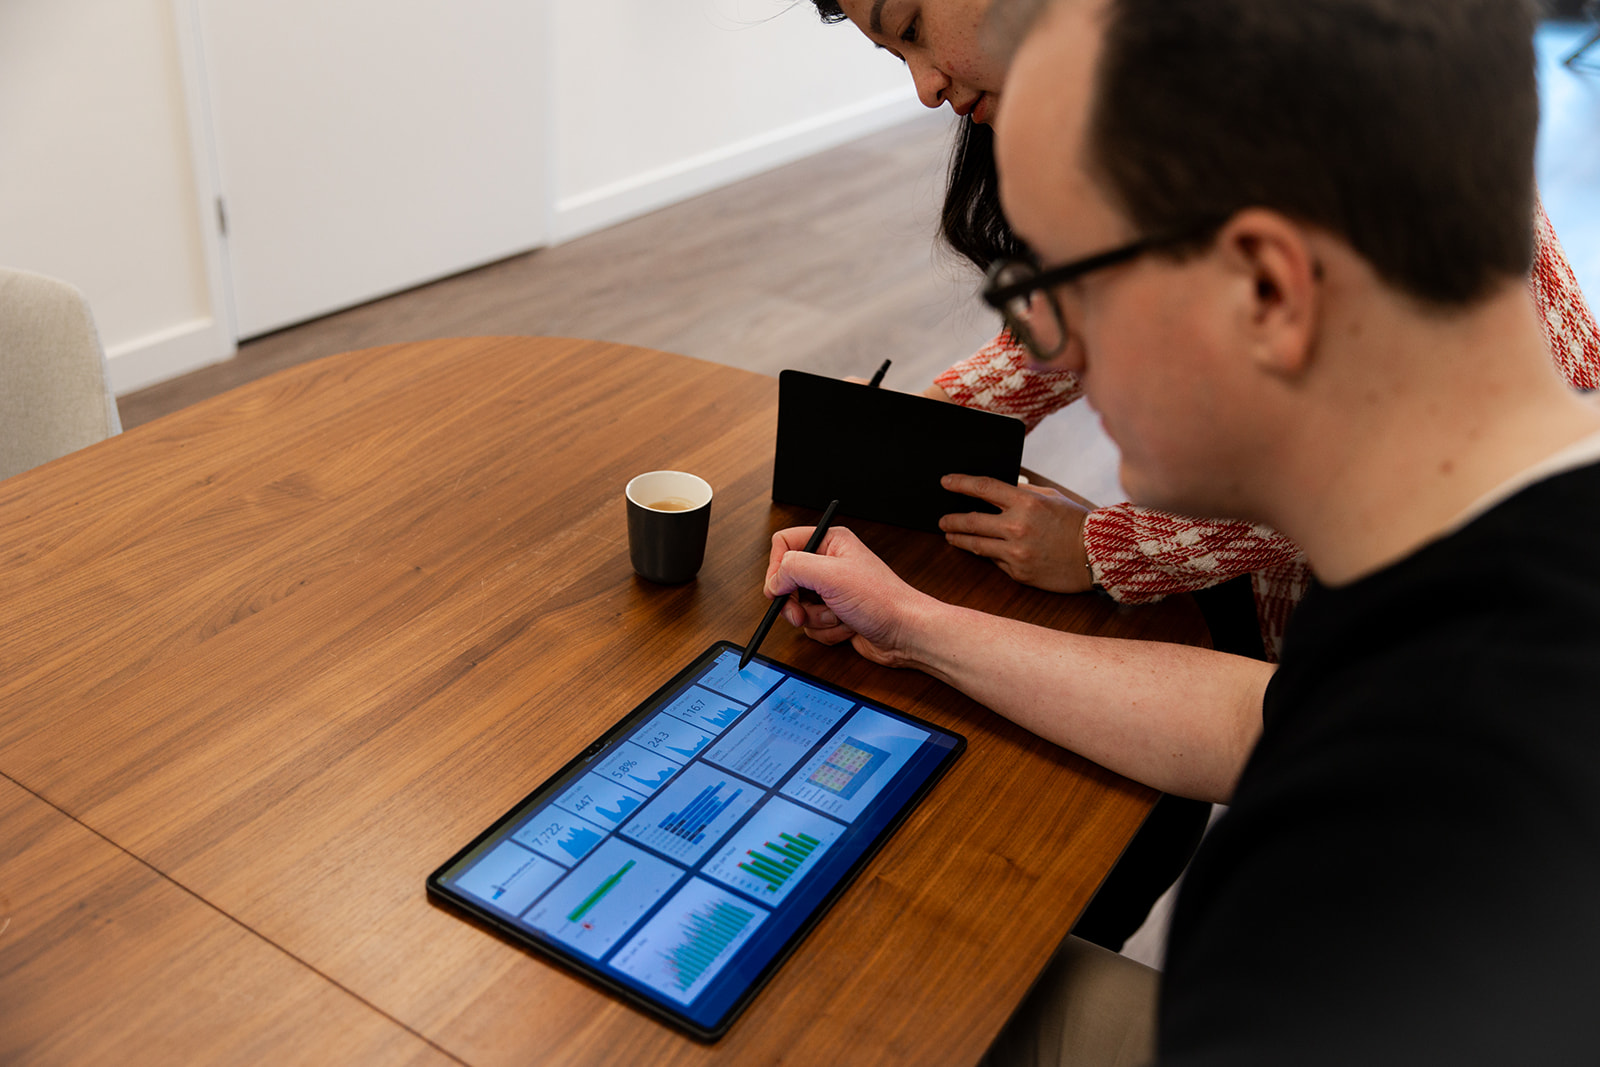
We are your BI team
You don't need a full BI team on payroll, but you do need the insights. We are your external BI department: flexible, affordable, and always available.
See your data come alive
Our dashboards are more than charts. They tell the story of your business and show you where the growth opportunities lie.
- Real-time data synchronization
- Interactive drill-downs
- Mobile accessible
- Automatic alerts
- Monthly reporting
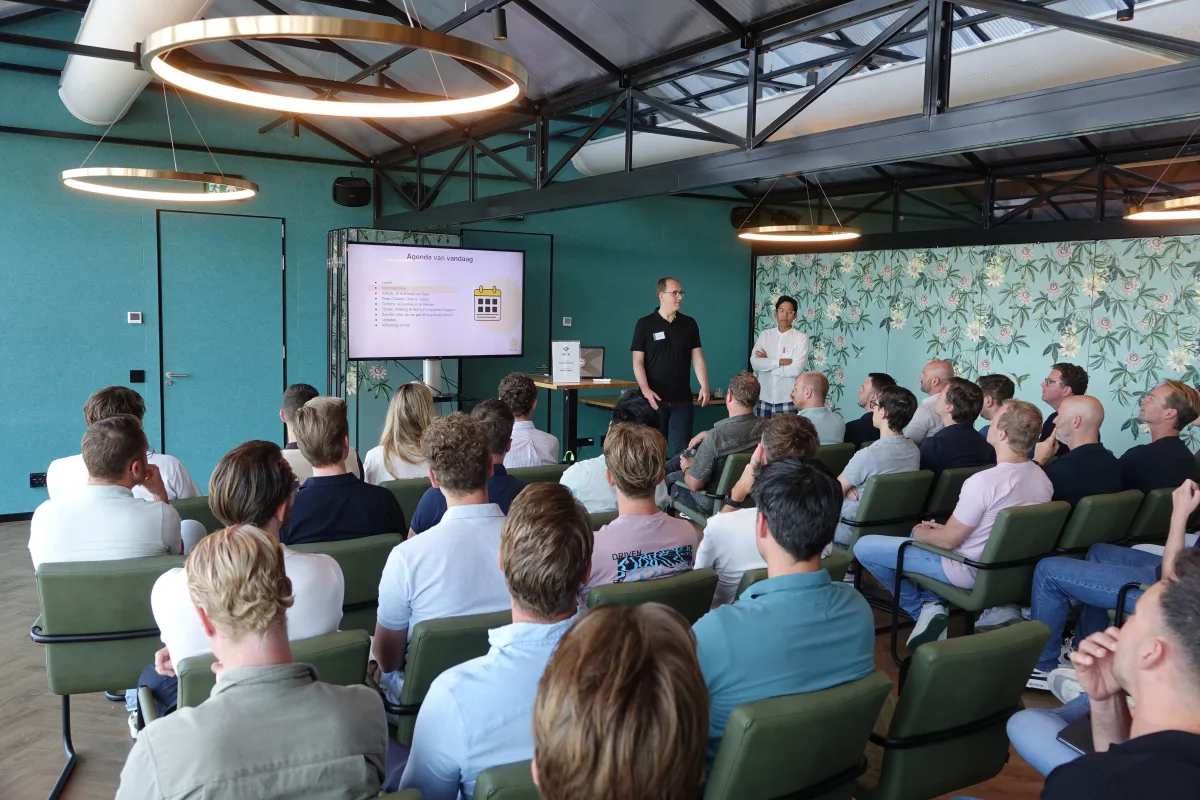
Active in the eCommerce community


Partners who trust us


Jop van Hooft
After years at Coolblue, I started MeerMetData to help eCommerce organizations turn their data into growth. I believe that every organization, large or small, deserves access to professional Business Intelligence.
Let's make your data work
Schedule a free consultation and discover how MeerMetData can help your eCommerce organization grow with data.
Schedule a free consultation →